To skip ahead, click on a section.
Organization Reporting
- Purchases (Global Purchases Report)
Event Specific Reporting
- Ticketing and Registration Reports
- Ticket Summary
- Ticket Purchase
- Bidder Reports
- Bidder Summary
- Bidder Purchase Summary
- Bidder Purchase Detail
- Top Bidders
- Messages
- Bids
- Item Reports
- Item Summary
- Live
- Top Silent by Bids
- Top Silent by Revenue
- Category Performance
- Bid History
- Drawing Purchases
- Donor Summary
- Item Favorites
- Financial Reports
- Revenue Summary
- Purchases
- Invoice Details
- Transactions
- Recurring Donations/ Payments
- CRM Exports
- Fundly CRM Export
ORGANIZATION REPORTING
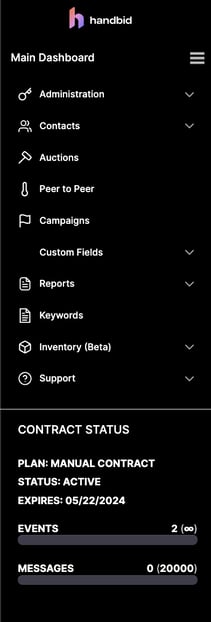
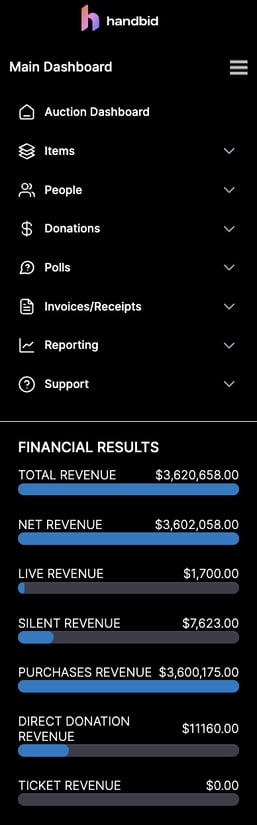
From the Main Dashboard at the Organization Level. To navigate click the MAIN DASHBOARD from the left menu and click REPORTS.
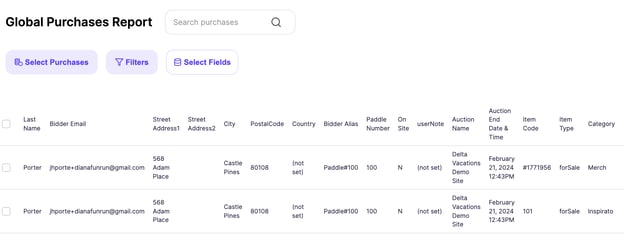
Purchases
This report will show you every item that was sold (silent, live, forSale, donations, tickets), who purchased it, how much, and payment status ORGANIZATION WIDE. You can access this report by going to the left-hand menu of the Main Dashboard, then click the REPORTS, then select "Purchases".
You can select Purchases by Event Name, Event Type, Event Status, Purchase Date and Purchase type then filter the report by Bidder Name, Item Name, Item Type, Item Category, Bid/Purchase Date and Purchase Size (price range).
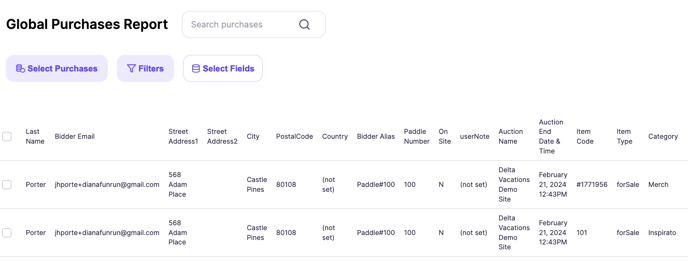
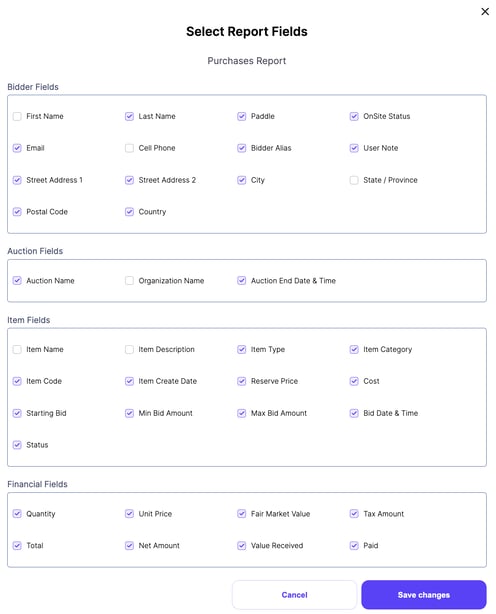
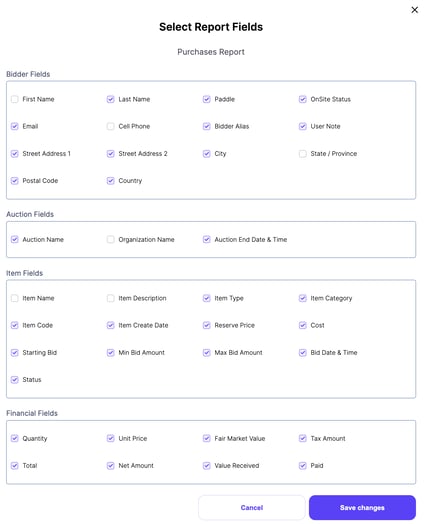
You can also choose which fields to view in this report and export by Current View, Current Selection or All Purchases. The fields are user specific. Each Auction Manager can determine which field they want to view. The fields chosen will become the default for that User/Auction Manager.
EVENT SPECIFIC REPORTING
From the Event Specific Dashboard. To navigate go to the specific event and click REPORTING on the left side menu.
Ticketing and Registration Reports
Ticket Summary Report
The ticket summary report shows the revenue performance of your ticket sales. There are a variety of charts on this page and we will break each of them down for you.
-
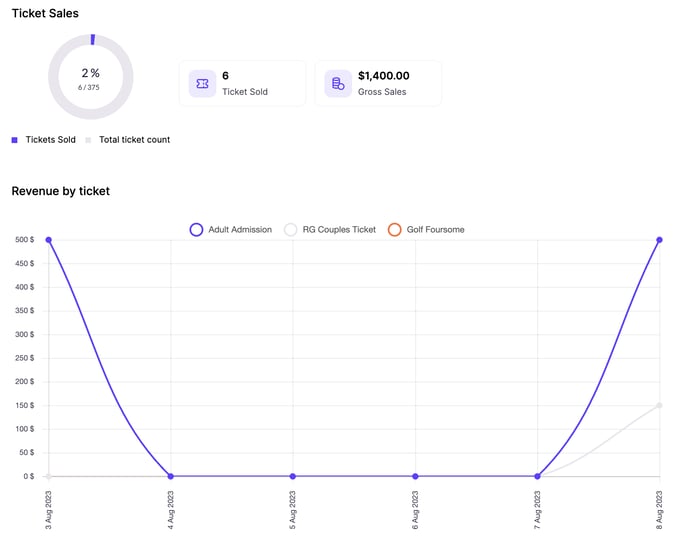
Ticket Sales Summary
The ticket sales summary is at the top of your auction page. The summary will show total tickets sold, total revenue, as well as a donut chart showing the number of tickets sold as a % of total tickets available.This ratio will depend on whether you have set a limited quantity of tickets. If you have not set a limit on the number of tickets that can be sold in your ticket settings, then this donut chart will always show 100%.
-
Revenue by Ticket by Date
Just below the summary is a chart showing revenue by ticket by date (show in the graphic above). This can give you a good visual on when ticket sales for particular types of tickets peaked. Just a note of caution if you have a lot of ticket types, this chart can get busy.
- Ticket Status
Next is a table showing the status of each ticket in your event. View the current price, number sold, status, and when sales on this ticket are expected to end. - Discount Codes Used
This chart will show each ticket and the unique discount codes applied to them. It will also total up for each combination the total amount of discount applied to the ticket revenue. - Generate a PDF Report
To print a report of all of this information in a PDF format, click on the icon that appears just above the report at the top right.
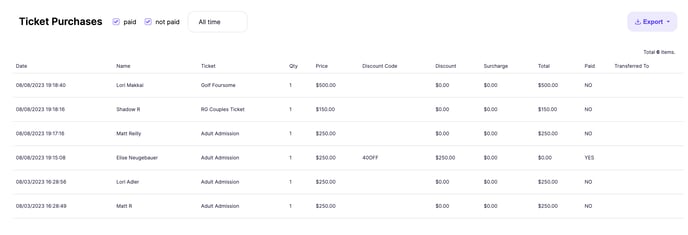
Ticket Purchases Report
The ticket purchases report will show all ticket purchases by date and allow you to filter those that are paid or not paid.
The report defaults to PAID for "Today". So if you open up this page and see no data, it's likely that you need to either adjust the date to: Last 7 days, Last 30 days, or All Time; or, you need to also look for "Not Paid" tickets.
Not paid tickets would be purchases that were entered through the backend manager and were not immediately processed through the Credit Card system. Instead, they would have been added to an invoice that had not yet been processed.
Bidder Reports
Bidder Summary
The Bidder summary report will show you an overall status of your bidders with regard to participation, devices used and bids placed.
You can access the Bidder Summary report by going to the left-hand menu of the Auction Dashboard, then click the REPORTING tab, then select "Bidders / Bidder Summary".
There are a number of charts in this report that we will discuss below:
- Total bids and bidders
These two numbers are found at the top right. In the graphic below, you see that this auction had 10 active bidders who placed 33 total bids. - Device Breakdown
Handbid tracks bids and bidders by device and provides the breakdown here for you. The number in the middle shows the percentage of bidders that used the "most used" interface. In this example, most of the bidders bid from the Handbid web interface (mobile and/or desktop). - Bids by Device
In addition to showing bidders by device, Handbid will show you where the bids were coming from. Again in this example (graphic above), 40% of the total bids were placed from a web interface. Just below the donut charts is a timeline view of bids placed by device. This can be fun to view to see the devices used by each bidder. - Top Bidders by Revenue & Bids
The next chart shows the top bidders based on the revenue they generated or the number of bids they placed. - Bid History
The final charts in the report show total bids by various timelines: Last Day, Last Hour and Total Event. Please note, the last hour chart can be tricky to get right if your auction has opened and closed and then opened again.
Bidder Purchase Summary
This report will show each bidder and their revenue breakdown - Silent, Live, Purchases, Donations and Tickets.
You can access the Bidder Purchase Summary report by going to the left-hand menu of the Auction Dashboard, then click the REPORTING tab, then select "Bidders > Bidder Summary".
In addition, the report will show the total value received by the bidder in exchange for their purchases or contributions and the net contribution. The total value received would be the total fair market value of any winning auction item plus the total amount of value received for any purchases.
The net contribution subtracts this total value received from the bidder's purchase total in the event.

Bidder Purchase Detail
This report shows a breakdown of purchases and winning bids on an individual basis. You can access the Bidder Purchase Detail by going to the left-hand menu of the Auction Dashboard, then click the Reporting tab, then select "Bidders> Bidder Purchase Detail". You can also always export this to a PDF.
Top Bidders
This report will show the top bidders in your auction and can be sorted by revenue (bidder with the highest revenue) and bid count (bidders with the highest number of bids). You can also filter this list by item type (silent or live), item category and bid/purchase date. For instance, you may choose to sort the top bidders report by the total revenue for silent auction items only. You can also export the report as the current view, current selection and all top bidders. You can access the Top Bidders report by going to the left-hand menu of the Auction Dashboard, then click the REPORTING tab, then select "Bidders > Top Bidders".

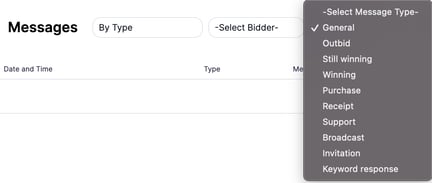
Messages
This report will be generated in the main window and will show the messages sent during the event. You can select to filter these by Type or Bidder. You can access the Messages report by going to the left-hand menu of the Auction Dashboard, then click the REPORTING tab, then select "Bidders > Messages".
- Filter Messages "By Type"
The default for this report is to show messages by Type, Broadcast. In this format, you will see all of the broadcast messages sent to your bidders during the auction.
The following message formats are available to view by Type:
- Broadcast - show all broadcast messages sent
- OutBid - show all outbid messages sent to bidders when they were outbid
- Was Winning - show all "You are already winning" messages to bidders who try to outbid themselves.
- Winning - show all "You are winning" this item messages sent to bidders
- Purchase - this will show all messages related to "purchases" and "donations"
- Receipt - this will show the "you have an invoice" messages sent to bidders
- Filter Messages "By Bidder"
If you want to see messages sent to a specific bidder, you can change "By Type" in the filter above the report to "By Bidder". Then you can select your bidder and view all messages sent to that bidder during the auction.
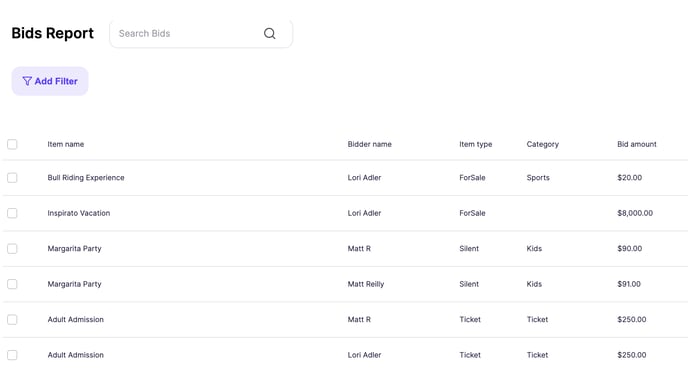
Bids
This report will display all bids made in the auction. You can filter by Bidder Name, Item Type, Category, Date Range and Amount Size (a selected price range). You can also export by Current View, Current Selection and All Bids.
Item Reports
Item Summary Report
This report shows you revenue performance, the status of the items and bids by item. You can also view item issues and item cost summary. You can access this report by going to the left-hand menu of the Auction Dashboard, then click the REPORTING tab, then select "Items > Item Summary". You can also EXPORT Item data through ITEMS on the left side menu. ADD LINK TO ITEMS EXPORT

Live
The report will be generated in the main window. In the live report, you will see the live auction item's name, the sale price, the FMV and the percentage of the FMV.You can access this report by going to the left-hand menu of the Auction Dashboard, then click the REPORTING tab, then select "Items > Live".

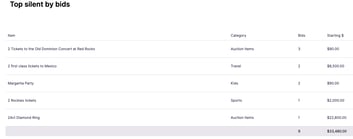
Top Silent by Bids
This report is a breakdown of the top silent auction items by the number of bids they received. This will show the top ten bids. In this report, the item's name, the item's category, the number of bids, starting price, ending price and percentage gained are all displayed. You can access this report by going to the left-hand menu of the Auction Dashboard, then click the REPORTING tab, then select "Items > Top Silent by Bids".
The percentage gained is going to show the percentage that the item gained from the starting price to the ending price.
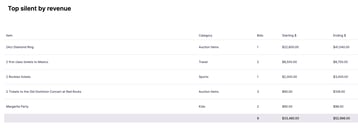
Top Silent by Revenue
This report is going to break down the top silent auction items by revenue and will show the item name, the category, the number of bids on the item, starting price, ending price and the percentage gained on the item. This will show the top ten bids. The items in the report will be ordered by the items with the highest ending prices. You can access this report by going to the left-hand menu of the Auction Dashboard, then click the REPORTING tab, then select "Items > Top Silent by Revenue".
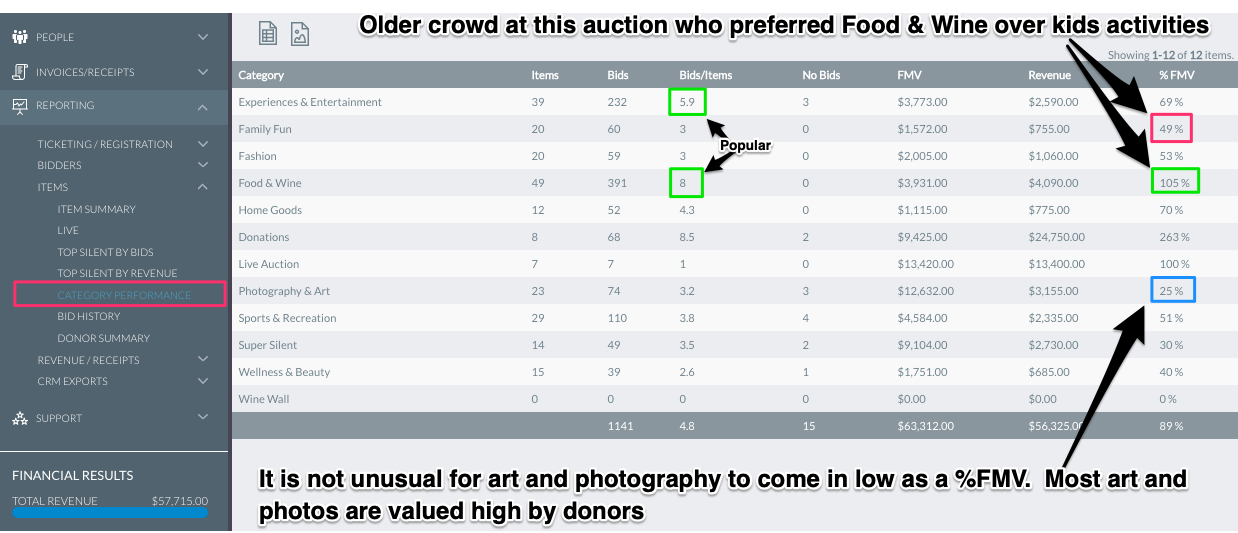
Category Performance
This report shows a useful breakdown of each category and how it performed. The key fields to review here are total bids, bids / item and % of FMV generated. This will give you an idea of which types of items were most popular in your silent auction. You can access this report by going to the left-hand menu of the Auction Dashboard, then click the REPORTING tab, then select "Items > Category".
Properly interpreting this report can give you valuable insights into your auction and help you determine how to improve it for following years. To explain this we have included the image to this report as a downloadable file.
- Handbid_Inc_.png(200 KB)
In this auction there were 12 categories, with 2 of them being forSale/appeals (Donations and Wine Wall). We can ignore those 2. In fact Wine Wall was not even run through Handbid based upon it being all zeroes.
For the rest, we see some interesting results.
- With regard to total bids and bids/item. Experiences and Entertainment (5.9 bids/item) and Food & Wine (8 bids/item) were clearly the most popular.
- As a % of FMV, it is also evident that both of these categories did well. In fact, Food and Wine generated 105% of FMV (which is great for a silent auction). Similarly, you can see that Family Fun did not perform as well in this area.
- Finally, you can see that Photography and Art did the worst as a % of FMV.
So what can we conclude from these numbers?
Regarding Photography and Art, very little. It is not surprising that the category did poorly as a % of FMV. Often times, donors of these items place a high Fair Market Value (FMV) on them making it difficult for them to perform well in silent auctions. Unless the auction is filled with art targeted at the artist's fans, we don't think you should worry too much about this.
Regarding the rest, it is clear (at least to us), that this crowd was more interested in dining out and travel and less interested in family passes to local museums and the zoo. We would assume this crowd was older and their children were mostly grown or moved out. They were in a stage of life where they could afford to travel, dine out, and drink finer wines...
The reason we bring this up is that it informs all of us about the types of items that will do well with this crowd. In future years, we would recommend less local family items and more wine, food, dining out, travel, and experiences items. In fact, that is exactly what we recommended here.
Bid History Report
This report allows you to view the bid history by category or by item.
You can access this report by going to the left-hand menu of the Auction Dashboard, then click the REPORTING tab, then select "Items > Bid History".
If you select a category but not an item, you can then generate a PDF report that will show the bid history for each item in that category.
If you select both a category and an item, you can generate a PDF of the item's bid history. However, Handbid will also populate the screen below with that item's bid history detail. This will allow you to download that data visible as a spreadsheet.
Note, you can only download item level data as a spreadsheet. There is no option to download every item into a single spreadsheet download.
An example of the report is below:

Donor Summary
You can access this report by going to the left-hand menu of the Auction Dashboard, then click the REPORTING tab, then select "Items > Donor Summary". The first step is to select a donor. If you have set up a contact record for each donor, then their information will be combined into a single report. If you have just loaded your donor's name into the donor field of an item, its likely they will show up in this report more than once (trying to merge those together would result in the risk of error, so we have not done that).
Once you have selected a donor, Handbid will show you each of the items that donor donated and how they performed. It will list bids, starting price, ending price and fair market value (FMV).

The best way to view this data is to actually generate a PDF report. You would hit the export button. Clicking on this will generate a PDF report showing the same information but also some summary information including total revenue generated and total bids.
An example of this report is below: 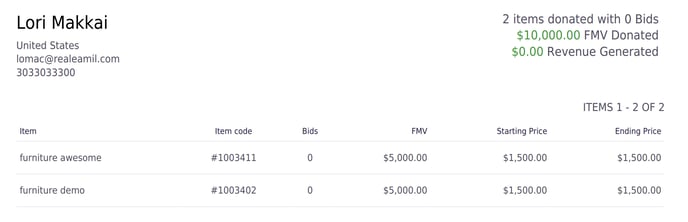
Item Favorites
The Item Favorites report allows you to view items that are marked as favorites by a bidder. This report shows only the current items that are marked. Therefore, if a bidder marks an item as a favorite and un-marks it, it will not appear in the report.
Financial Reports
Revenue Summary Report
You can access this report by going to the left-hand menu of the Auction Dashboard, then click the REPORTING tab, then select “Financial>Revenue Summary”. This report will show a summary of the revenue generated at the event.
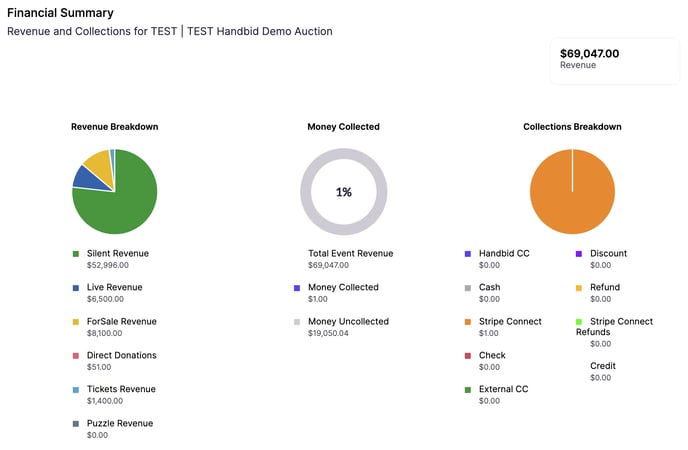
The report provides the following:
- Revenue Breakdown
This is a pie chart and a breakdown of revenue across main item categories: Silent, Live, ForSale, Appeals (Donations) and Tickets. - Money Collected
This is a status of how much money has been collected vs. uncollected. Remember, in order to adhere to credit card policies and minimize disputes, Handbid does not auto-charge any clients for auction purchases. Thus, bidders either pay their invoices directly on their phone or they must pay at checkout. - Collections Breakdown
This will show you a breakdown of the collected funds based on type. This includes both online (Handbid CC or Stripe Connect) payments or offline (Check, External CC, Cash, or Discount). In addition, Handbid will show you the amount of refunds processed. - Premiums and Tax Breakdown
Just below the charts is a breakdown of revenue vs. premiums and tax. If this chart gives you a headache, or you simply don't understand it, just show it to your accountant and they will be able to help break it down for you. If you have no premiums or tax in your auction, then there will be a lot of zeros in this report.
Purchases
This is probably one of the most popular and useful reports in the system. This report will show you every item that was sold (silent, live, forSale, donations, tickets), who purchased it, how much, and payment status. You can access this report by going to the left-hand menu of the Auction Dashboard, then click the REPORTING tab, then select "Financial >Purchases".
You can sort the filter the report by Bidder Name, Item Name, Item Type, Item Category, Bid/Purchase Date and Purchase Size (price range).
You can also choose which fields to view in this report and export by Current View, Current Selection or All Purchases. The fields are user specific. Each Auction Manager can determine which field they want to view and export and the fields chosen will become the default for that User/Auction Manager.
Invoice Details
This report will show all of the details of a bidders invoice in a spreadsheet format including credit card fees, method of payment and whether they are paid in full or have a balance. You can also EXPORT Invoice data through Invoices/Receipts on the left side menu of Handbid Manager. Click here for more information on Invoices/Receipts as well as sending and exporting.
Transactions
This report will detail all credit card, cash, check and external transactions run through Handbid.
Recurring Donations Payments
If you have recurring donations enabled, this report will show the donation amount and the balance remaining of those donors. CLICK HERE more information about recurring donations
CRM Exports
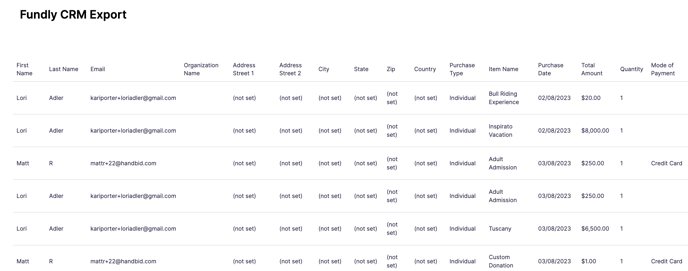
Fundly CRM Export
This is a report Handbid created to simplify exporting to Fundly. However, many of our clients find it useful as well! We do not provide specific reports for other CRM's because there is a direct integration and it is not necessary to export. Currently Handbid integrates with Kindful, Bloomerang, Salsa and Salesforce NPSP. CLICK HERE to view more information about CRM Integration with Handbid.